

Monitor performance
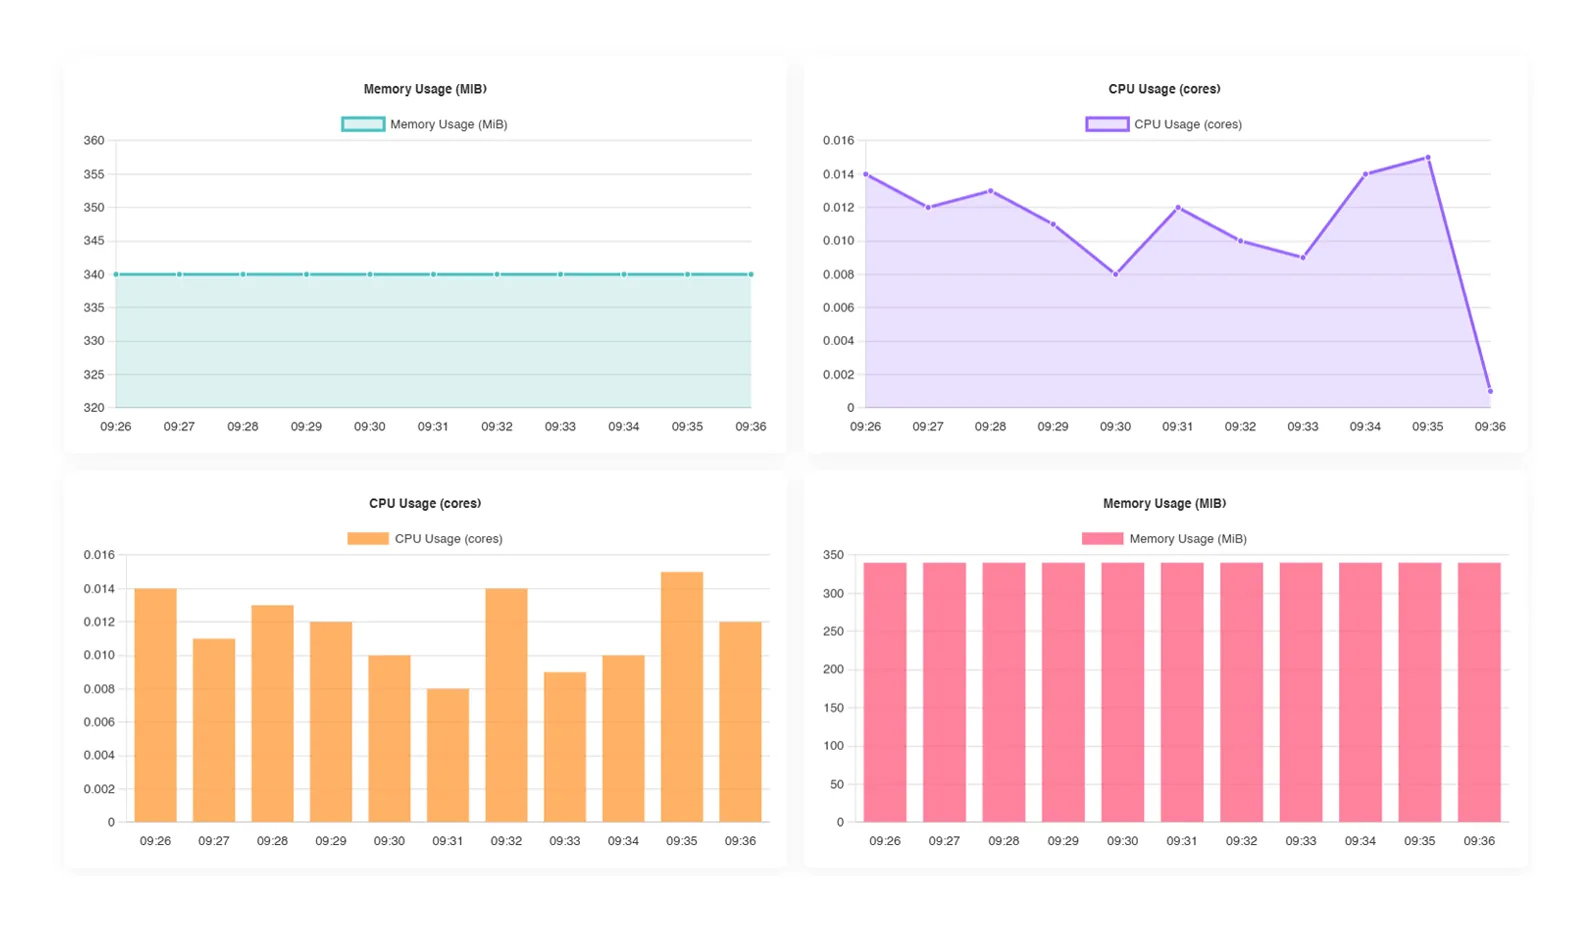
Every EasyInstance instance has real-time and historical metrics. Open the metrics tab and the data is already there.
What you can do
- Switch between live and history. Choose Live, 1h, 6h, 24h or 7d. The dashboard redraws without losing your place.
- Track CPU, memory and processes. See current usage with peak tracking, and a CPU-versus-memory chart that shows which workloads cost the most.
- See where storage goes. View how your disk is used, and a timeline of resource peaks and instance events as they happen.
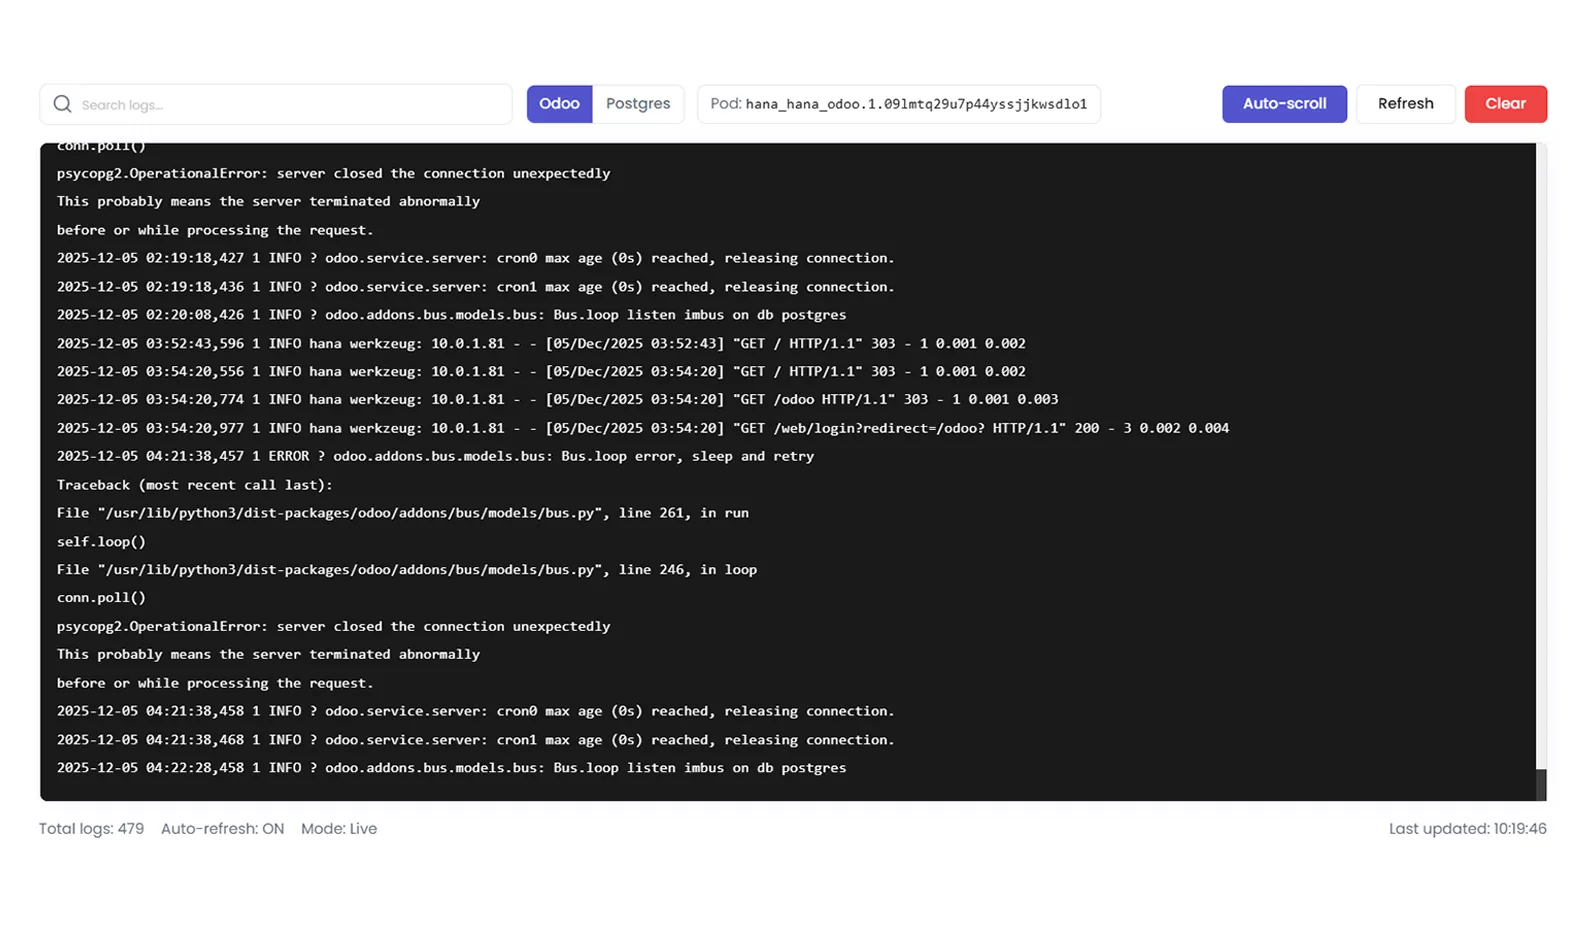
- Read the logs. Review activity and system logs for each instance to follow events, track changes and troubleshoot.
Monitoring alerts
Live monitoring and alerts are part of managed hosting.